As Apache Cassandra consultants, we get to review a lot of data models. Best practices claim that the number of tables in a cluster should not exceed one hundred. But we rarely see proper benchmarks evidencing the impact of excessive tables on performance. In this blog post, we’ll discuss the potential impacts of large data models and run benchmarks to verify our assumptions.
Evaluating the impacts
Here are the most obvious impacts that data models with large numbers of tables can have on a Cassandra cluster:
Heap pressure
For each table defined in a Cassandra schema, whether the table is being used or not, 1MB of heap space will be used to store table metadata. Once you reach 1000 tables, it’s 1GB of heap space that will never be released but will still be scanned over during garbage collections.
Memtables, flushing and compactions
When writing to Cassandra, data gets appended to the commit log for safety and written into memory in memtables. Each table from the data model has its own memtable, which can be stored on heap (by default) or off heap depending on the nodes configuration. The largest memtables get flushed to disk once the total space used by memtables reaches a configured ratio of the total memtable allocated space in memory (memtable_total_space_in_mb).
Other notable events that can trigger flushes are:
- The
nodetool flushcommand - Taking snapshots (which can be achieved using
nodetool snapshot) - Anti-entropy repairs
By default, Cassandra runs with two memtable flush writers, which means that only two memtables can get flushed at once. Also, there are several post flush operations which are scheduled after each memtable flush. These post flush operations will be serialized for correctness, meaning that a single post flush can happen at once. In extreme cases, when post-flush operations get bottlenecked, flushes get blocked, mutations stop being processed and pile up in the queue. This leads to intense heap pressure, long GC pauses and quickly impact the whole cluster.
Since there are more memtables in memory, they get flushed prematurely and are smaller overall. This will effectively require more cycles to compact the SSTables to higher tiers, generating write amplification (ie: how many times data gets rewritten to disk over its lifetime). For example, a single table on a cluster configured with 2GB of memtable space would flush SSTables of approximately 200MB, while with a hundred tables they would flush at approximately 2MB. In the worst case it could take 3 to 4 rounds of compactions before they reach 200MB when using the Size Tiered Compaction Strategy.
Repairs
During the repair process, Cassandra will compute Merkle trees to efficiently compare data between nodes through validation compactions. Merkle trees are space efficient structures that store hashes. One Merkle tree will be built per node and table in the schema, which can generate a lot of overhead as the number of table grows in the cluster. Also, a large number of tables will generate a lot of small streams in case of entropy, leading to compaction overhead again as these small SSTables will need to be compacted after repair. Many operations in the repair process being handled at the table level, the more there are, the longer repair will take.
Client applications
Upon initialization of the Cassandra drivers, the schema will be downloaded locally in the client app to support driver features. As the schema grows, client startup time gets longer, delaying service availability.
Monitoring
Cassandra exposes many per table metrics which are very useful to monitor cluster health and troubleshoot app performance issues. The overhead of hundreds/thousands of tables on the number of exposed metrics is massive. Aside from requiring larger storage volume, they will put a lot of pressure on the exporters/scrapers and the ingestion processes.
What usually happens when too many metrics are available for extraction is that they will fail being extracted on a regular basis, making monitoring partially unavailable and leaving ops blind to what the cluster is currently going through. The graphite exporter even used to crash and require a restart of the Cassandra process to get the metrics exported again.
Benchmarking Cassandra with variable numbers of tables
In order to perform this test, a new tlp-stress workload was created based upon the existing KeyValue workload.
The MultiTableKeyValue will fan out operations to a parameterized number of tables using the key value data model. Operations will spread equally across tables.
To run a stress test with a fan out to 100 tables with a 80% writes / 20% reads workload, we used the following command:
tlp-stress run MultiTableKeyValue -d 30m -p 10M -c 50 --csv 100_tables.csv --workload.nbTables=100 -t 8 -r 0.2
The same cluster was used to perform all benchmarks and the keyspace was dropped between runs.
We ran the stress tests in AWS, using i3.2xlarge instances (8 vCPUs, 61GB RAM and 2TB NVMe direct attached storage), using Apache Cassandra latest stable release to date, 3.11.9.
Heap was set to 31G with G1GC, which is the most stable JVM setup you can afford these days, while waiting for Cassandra 4.0 and jdk11+.
Benchmark results
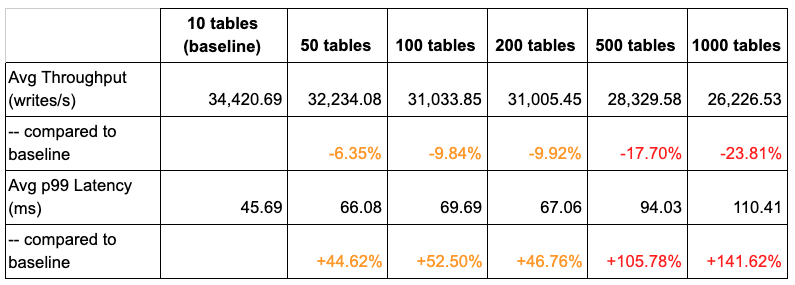
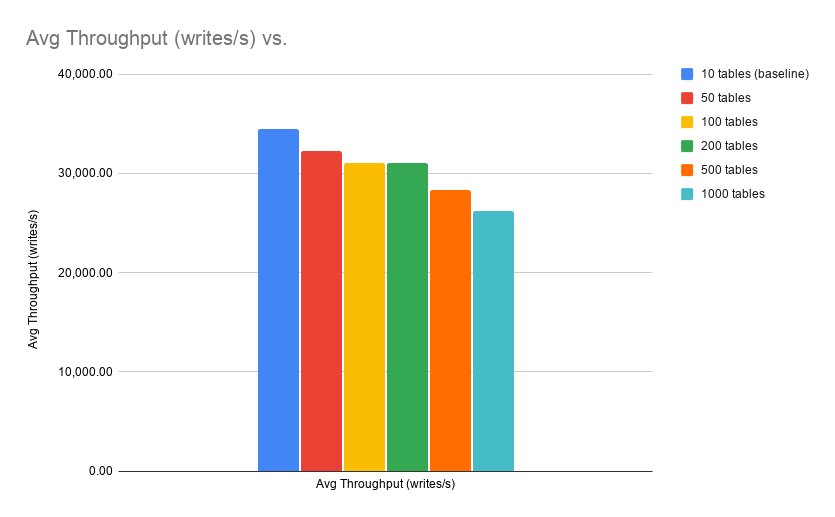
The results showed a throughput that was 23% slower with 1000 tables compared to 10 tables: from 68M writes down to 48M on a 30 minutes run.
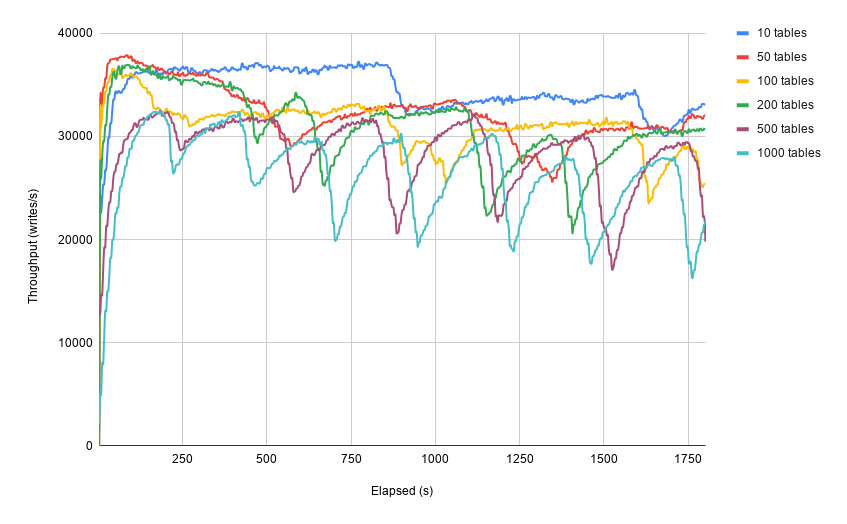
As the number of tables grew, the write throughput got less stable most probably due to contended flush and post flush operations, slowing down writes when too many operations were competing.
Results are summarized in the following table:

Looking at our Cassandra dashboards in Grafana, we can see that the 500 and 1000 tables tests struggled to get metrics properly collected as expected:

Metrics recorded by tlp-cluster on the client side give a better picture of all tests:


Pending compactions also piled up fairly high as the number of table grew between tests, eventually catching up after the load ended:

While compactions caught up fairly quickly thanks to small file sizes, on longer runs we would end up with large compactions using all the compactors for larger tiers, leaving lots of small files unable to be compacted in due time in the smaller tiers. If the workload reads recent data more, this could make sstables per read grow over reasonable levels, impacting read latencies.
Takeaways
While Cassandra clusters can scale to a high number of nodes while linearly increasing performance, creating too many tables and keyspaces in a data model will have a significant negative impact on performance. Over 200 tables, the impact gets massive enough to take actions in reducing their number. If some tables share the same columns, it could be interesting to merge them into a single one, adding a column to the partition key to distinguish data belonging to different tables. A high number of tables could also be a sign that too many services rely on a single cluster. This is rarely a good idea as Cassandra cannot isolate resources, and a misbehaving service could impact all other services sharing the cluster. Splitting clusters and putting critical services on dedicated clusters is a recommended practice which can help reduce the number of tables per cluster.


